CMIP6 projected relative sea level change data is available for every decade from 2020-2100, relative to 1994-2015 conditions.
CMIP5 projected relative sea level change data is available for 2006 and for every decade from 2010-2100, relative to 1986-2005 conditions.
Projections of Relative Sea-Level Change (developed by Natural Resources Canada)
To help Canadians plan, prepare for, and remain resilient to projected sea-level changes, Natural Resources Canada (NRCan) has developed a new dataset of present and future relative sea-levels (James et al., 2021). The dataset provides projections for relative sea-level change, which is the change in ocean height relative to land and is the apparent sea-level change experienced by coastal communities and ecosystems. It is a combined measure of both changes to ocean levels due to climate change and vertical land movements, as described below.
Projections are available at a resolution of 0.1° (approximately 11 km latitude, 2-8 km longitude), and for 2006 and every decade from 2010-2100, relative to 1986-2005 conditions.
For CMIP6, projections are relative to 1994-2015 conditions and the data is available for four Shared Socio-economic Pathway (SSP) emissions scenarios (SSP1-2.6, SSP2-4.5, SSP3-7.0 and SSP5-8.5) and two enhanced scenarios.
For CMIP5, projections are relative to 1986-2005 conditions and data is available for three Representative Concentration Pathways (RCP) emissions scenarios (RCP 2.6, RCP 4.5, RCP 8.5) and an enhanced scenario.
Use relative sea-level rise data together with other types of data
When combined with other types of data such as estimates of storm surge, waves, tides, and additional local-scale vertical land motion, such as subsidence on river deltas, this relative sea-level data is expected to contribute significantly to coastal flood risk assessments and adaptation decision-making.
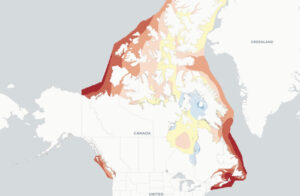
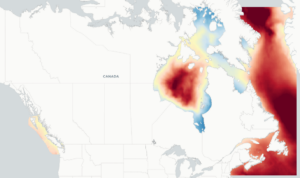
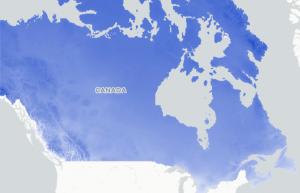
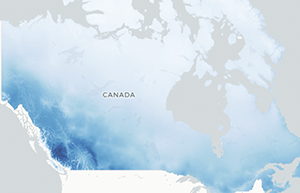
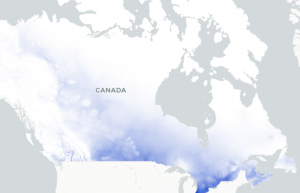
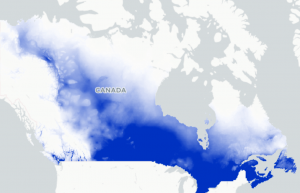
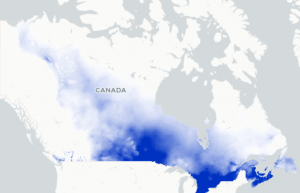
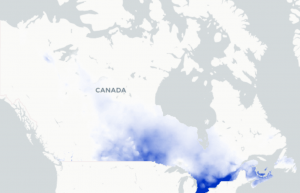
Relative sea-level change varies greatly based on where you live in Canada
Relative sea-level change along Canada’s coastlines varies greatly from location to location, and can differ substantially from the projected global average sea-level change. Some Canadian coastlines in Atlantic Canada can expect relative sea-level rise that is larger than the projected global sea-level rise. Conversely, other Canadian coastlines, where the land is rising faster than the ocean, such as Hudson Bay and much of the Canadian Arctic Archipelago, can expect a relative sea-level fall.
Guidance on emissions scenarios
CMIP6
Data estimates are available for four emissions scenarios (SSP1-2.6, SSP2-4.5, SSP3-7.0 and SSP5-8.5) as reported in the Sixth Assessment Report of the Intergovernmental Panel on Climate Change (IPCC AR6). For each scenario, lower, median and upper estimates of projected relative sea-level change are provided, corresponding to the 17th, 50th and 83rd percentiles of the full ensemble of global climate models. Two additional enhanced scenarios are also available, described below. All projections are based on open ocean basin changes that are extrapolated to the coastline (which does not include explicit modelling of shallow water effects).
Two low-probability, high-impact storylines are also provided. The first is based on CMIP6 low-confidence projections that incorporate additional information on Antarctic Ice Sheet stability. The storyline projection lies above the upper envelope of the SSP5-8.5 scenario. The second is based on an approach from Van de Wal et al, (2022) that was co-developed by scientists and practitioners by combining physical evidence and approaches currently used in policy environments. This scenario is equivalent to the 98.33rd percentile of the medium confidence projections. These two storylines can be accessed via the time series plots that users receive when selecting a gridcell on the map.
CMIP5
Data estimates are available for three RCP scenarios: RCP 2.6 (low), RCP 4.5 (medium), and RCP 8.5 (high) – as reported in the Fifth Assessment Report of the Intergovernmental Panel on Climate Change (IPCC AR5; Church et al, 2013a,b). For each scenario, lower, median and upper estimates of projected relative sea-level change are provided, corresponding to the 5th, 50th and 95th percentiles of the full ensemble of Global Climate Models. An additional Enhanced Scenario is also available, described below. All projections are based on open ocean basin changes that are extrapolated to the coastline (which does not include explicit modelling of shallow water effects).
In the case of low tolerance to risk and for project time frames extending past 2100, it would be prudent to consider the enhanced scenario described below. The enhanced scenario adds a further 65 cm of global sea-level rise to the median projection of the highest (RCP8.5) climate scenario at 2100. This 65 cm reflects a potential additional contribution from the Antarctic Ice Sheet.
For long-term decisions that may be influenced by sea-level changes, the precautionary principle would indicate using the upper end of the highest emissions scenario. In the case of very low tolerance to risk and for long project timeframes, it may be appropriate to consider the storylines mentioned above. In other situations, the use of higher or lower sea-level values, or a range of projected sea-level change, may be more appropriate.
For detailed technical guidance on the use of sea-level projections see Relative sea-level projections for Canada based on the IPCC Fifth Assessment Report and the NAD83v70VG national crustal velocity model (James et al, 2021) and GEOSCAN for the full publication and data.
More about this dataset
Projected sea-level changes in this dataset include the effects of changes in glacier and ice-sheet mass loss, thermal expansion of the oceans, changing ocean circulation conditions, and human-caused changes in land water storage, as summarized in IPCC AR6. A new land motion model developed by the Canadian Geodetic Survey (Robin et al., 2020; Canadian Geodetic Survey, 2019) was incorporated into the data to replace less-accurate land motion values utilized by the IPCC AR6.
Vertical land movements in Canada largely result from loading and unloading of the Earth’s surface by ice sheets. During the last ice age that ended about seven thousand years ago, much of Canada was covered with thick ice sheets that weighed down the surface of the Earth. Deep within the Earth, rock yielded and flowed and the land under the ice was pushed down. At the edges of the ice sheets, the land was pushed up. Following the thinning and retreat of those ice sheets, land that was pushed down started to rise, while land that was uplifted began to sink, a process that continues to the present day. Tectonic effects causing earthquakes and land subsidence caused by sediment compaction on coastal deltas can also generate vertical movements that contribute to relative sea-level change, but these are not accounted for in these projections.
It should be noted that the crustal velocity model used for the Relative Sea-Level Change data available on ClimateData.ca is based on measurements of land motion made on bedrock. Therefore, local subsidence and compaction effects in locations with a thick sequence of unconsolidated sediment, i.e. large deltas such as those at the mouth of the Fraser and Mackenzie rivers (James et al, 2021), are not reflected in the crustal velocity model. Consequently, the sea-level projections in such locations should be adjusted to incorporate, if available, local knowledge of vertical land motions. For this reason, the Vertical Land Motion data from the crustal velocity model used for this dataset is provided. This will allow users to remove the effects of vertical land motions as calculated in the crustal velocity model from the sea level data found on ClimateData.ca with a view to replace it with values based on other sources of local knowledge of vertical land motion.
References
- Canadian Geodetic Survey. (2019). NAD83(CSRS) v7. https://webapp.geod.nrcan.gc.ca/geod/tools-outils/nad83-docs.php
- Church, J.A., P.U. Clark, A. Cazenave, J.M. Gregory, S. Jevrejeva, A. Levermann, M.A. Merrifield, G.A. Milne, R.S. Nerem, P.D. Nunn, A.J. Payne, W.T. Pfeffer, D. Stammer and A.S. Unnikrishnan, 2013a. Sea Level Change. In: Climate Change 2013: The Physical Science Basis. Contribution of Working Group I to the Fifth Assessment Report of the Intergovernmental Panel on Climate Change [Stocker, T.F., D. Qin, G.-K. Plattner, M. Tignor, S.K. Allen, J. Boschung, A. Nauels, Y. Xia, V. Bex and P.M. Midgley (eds.)]. Cambridge University Press, Cambridge, United Kingdom and New York, NY, USA.
- Church, J.A., P.U. Clark, A. Cazenave, J.M. Gregory, S. Jevrejeva, A. Levermann, M.A. Merrifield, G.A. Milne, R.S. Nerem, P.D. Nunn, A.J. Payne, W.T. Pfeffer, D. Stammer and A.S. Unnikrishnan, 2013b. Sea Level Change Supplementary Material. In: Climate Change 2013: The Physical Science Basis. Contribution of Working Group I to the Fifth Assessment Report of the Intergovernmental Panel on Climate Change e [Stocker, T.F., D. Qin, G.-K.
- Plattner, M. Tignor, S.K. Allen, J. Boschung, A. Nauels, Y. Xia, V. Bex and P.M. Midgley (eds.)]. Available from www.climatechange2013.org and www.ipcc.ch.
- James, T.S., Robin, C., Henton, J.A., and Craymer, M., 2021. Relative Sea-level Projections for Canada based on the IPCC Fifth Assessment Report and the NAD83v70VG National Crustal Velocity Model; Geological Survey of Canada, Open File 8764, 1 .zip file, https://doi.org/10.4095/327878
- Robin, C.M.I., Craymer, M., Ferland, R., James, T.S., Lapelle, E., Piraszewski, M., and Zhao, Y., 2020. NAD83v70VG: A new national crustal velocity model for Canada; Geomatics Canada, Open File 0062, 1 .zip file, https://doi.org/10.4095/327592
- van de Wal, R. S. W., Nicholls, R. J., Behar, D., McInnes, K., Stammer, D., Lowe, J. A., et al. (2022). A high-end estimate of sea level rise for practitioners. Earth’s Future, 10, e2022EF002751.